
Introduction
This article will describe how to monitor a WordPress installation with Prometheus. The setup requires a working Kubernetes cluster with the Prometheus Operator installed. This article will describe basic three use cases.
Use Cases
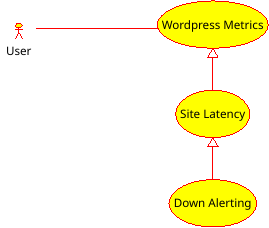
WordPress Metrics
We want to see basic metrics about out site, like how many posts are published, how many comments there are on our site and how many users are registered.
Site Latency
We want to see the site latency in milliseconds to our site.
Down Alerting
We want to be informed if our site goes offline for whatever reasons.
Metrics Projects
Surprisingly, there are not many Prometheus monitoring plugins for WordPress. A search in Google shows just four results. Here is a list of projects that we will use for our use case.
https://github.com/kotsis/wordpress_exporter
This project provides WordPress metrics for Prometheus by reading directly the MySQL database and is written in Go. This project is interesting because we can learn some basic Go and we will use it to create a Docker container that we run alongside WordPress in our cluster to provide metrics to Prometheus.
https://github.com/origama/wordpress-exporter-prometheus
This is a very simple WordPress plugin that can provide metrics to Prometheus. We will also use this plugin because then we can have the latency of our WordPress site in addition to the usual WordPress metrics. But more on that later.
Here are some projects that are not useful for our use case, but are mentioned for completeness.
https://github.com/PeterBooker/wp-prompress
The author writes that it suppose to be a WordPress Prometheus client, but the last commit is still just “initial file structure” one year ego. My guess is that this project is not developed anymore.
https://de.wordpress.org/plugins/woo-prometheus-metrics/
This is a WordPress plugin that provides metrics specifically for Woocommerce. This is not what we want here of course.
wordpress_exporter
https://github.com/devent/wordpress_exporter
The “wordpress_exporter” project will provide basic WordPress metrics by reading the MySQL database and it will cover our first use case. It can not give us the site latency since the “wordpress_exporter” runs as a separate container and for the same reason it can not give us the down alerting. As the first step I have forged the original project on Github and created a Dockerfile for it. We setup Docker Hub to create automatic builds for it. For that I have followed the guide provided: Building Docker Containers for Go Applications.
The result is a Docker image that will run a container for the Go “wordpress_exporter”. It will provide a metric at the URL http://wordpress-exporter:8888/metrics.
Now we can deploy the “wordpress_exporter” on our Kubernetes cluster.
---

apiVersion: v1
kind: Service
metadata:
  name: wordpress-exporter
  namespace: www-muellerpublic-de
  labels:
    app: wordpress-exporter
    tier: metrics
spec:
  ports:
  - name: "metrics"
    port: 8888
    targetPort: 8888
  selector:
    app: wordpress-exporter

---

apiVersion: extensions/v1beta1
kind: Deployment
metadata:
  name: wordpress-exporter
  namespace: www-muellerpublic-de
  labels:
    app: wordpress-exporter
    tier: metrics
spec:
  replicas: 1
  selector:
    matchLabels:
      app: wordpress-exporter
      tier: metrics
  template:
    metadata:
      labels:
        app: wordpress-exporter
        tier: metrics
    spec:
      containers:
      - image: erwin82/wordpress_exporter:latest
        name: wordpress-exporter
        env:
        - name: WORDPRESS_DB_NAME
          value: "wordpressdb"
        - name: WORDPRESS_DB_USER
          value: "wordpress"
        - name: WORDPRESS_DB_PASSWORD
          value: "wordpress1234"
        - name: WORDPRESS_DB_HOST
          value: "db"
        - name: WORDPRESS_DB_PORT
          value: "3306"
        ports:
        - containerPort: 8888
          name: "metrics"
      restartPolicy: Always

---
We will create a new Promethus ServiceMonitor for the Prometheus operator.
[python title=“sm.yaml”]
apiVersion: monitoring.coreos.com/v1
kind: ServiceMonitor
metadata:
name: wordpress-exporter
namespace: www-muellerpublic-de
spec:
selector:
matchLabels:
app: wordpress-exporter
endpoints:
— port: metrics
[/python]
Since the Promethus server runs in the namespace “monitoring” we need to create RoleBinding and a Role to allow the server access to the namespace where our WordPress deployment is.
[python title=“role.yaml”]
—
apiVersion: rbac.authorization.k8s.io/v1
kind: RoleBinding
metadata:
name: prometheus-k8s
namespace: www-muellerpublic-de
roleRef:
apiGroup: rbac.authorization.k8s.io
kind: Role
name: prometheus-k8s
subjects:
— kind: ServiceAccount
name: prometheus-k8s
namespace: monitoring
—
apiVersion: rbac.authorization.k8s.io/v1
kind: Role
metadata:
name: prometheus-k8s
namespace: www-muellerpublic-de
rules:
— apiGroups:
— “”
resources:
— services
— endpoints
— pods
verbs:
— get
— list
— watch
—
[/python]
If everything was correctly deployed then we should now see a new target in our Prometheus server.
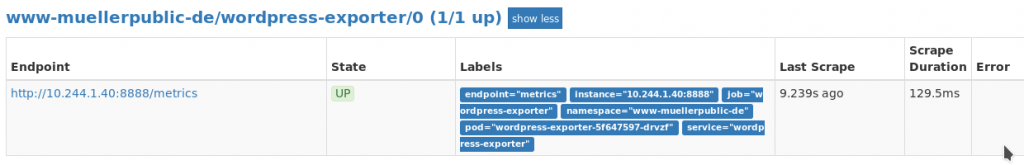
The “wordpress_exporter” exports the following metrics:
wp_num_comments_metric{endpoint=“metrics”,instance=“10.244.1.40:8888”,job=“wordpress-exporter”,namespace=“www-muellerpublic-de”,pod=“wordpress-exporter-5f647597-drvzf”,service=“wordpress-exporter”}
wp_num_posts_metric{endpoint=“metrics”,instance=“10.244.1.40:8888”,job=“wordpress-exporter”,namespace=“www-muellerpublic-de”,pod=“wordpress-exporter-5f647597-drvzf”,service=“wordpress-exporter”}
wp_num_users_metric{endpoint=“metrics”,instance=“10.244.1.40:8888”,job=“wordpress-exporter”,namespace=“www-muellerpublic-de”,pod=“wordpress-exporter-5f647597-drvzf”,service=“wordpress-exporter”}
origama/wordpress-exporter-prometheus
The project is a WordPress plugin that provides metrics under the endpoint http://wordpress/wp-json/metrics and we will use the Prometheus Additional Scrape Configuration to add the endpoint to our Prometheus server.The installation is very simple. Just download the zip archive somewhere and use WordPress to install the archive as a new plugin. The plugin will use the WordPress API to provide basic WordPress metrics like number of posts, comments and users. What important for us is that the plugins runs inside WordPress so we can use it to return the site latency time and create an alert if the site becomes unreachable.
After the installation of the WordPress plugin we add the additional scrape configuration. For that we create the file “prometheus-additional.yaml” with the following content.
[python title=“prometheus-additional.yaml”]
— job_name: “www-muellerpublic-de”
static_configs:
— targets: [“www.muellerpublic.de”, “www.mueller-public.de”]
scrape_interval: “30s”
metrics_path: “/wp-json/metrics”
scheme: “https”
[/python]
Now we create a Kubernetes secret from this file.
kubectl create secret generic additional-scrape-configs --from-file=prometheus-additional.yaml --dry-run -oyaml > additional-scrape-configs.yamlWe deploy it into the “monitoring” namespace.
kubectl -n monitoring apply -f additional-scrape-configs.yamlWe edit the Prometheus custom resource definition to reference our secret and add the following snippet.
kubectl -n monitoring edit prometheus k8s[python title=“prometheus”]
spec:
additionalScrapeConfigs:
key: prometheus-additional.yaml
name: additional-scrape-configs
[/python]
We should now have an additional scrape target in our Prometheus server.
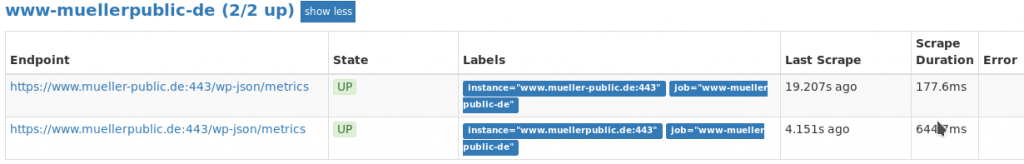
The plugin exports similar metrics as the “wordpress_exporter” container.
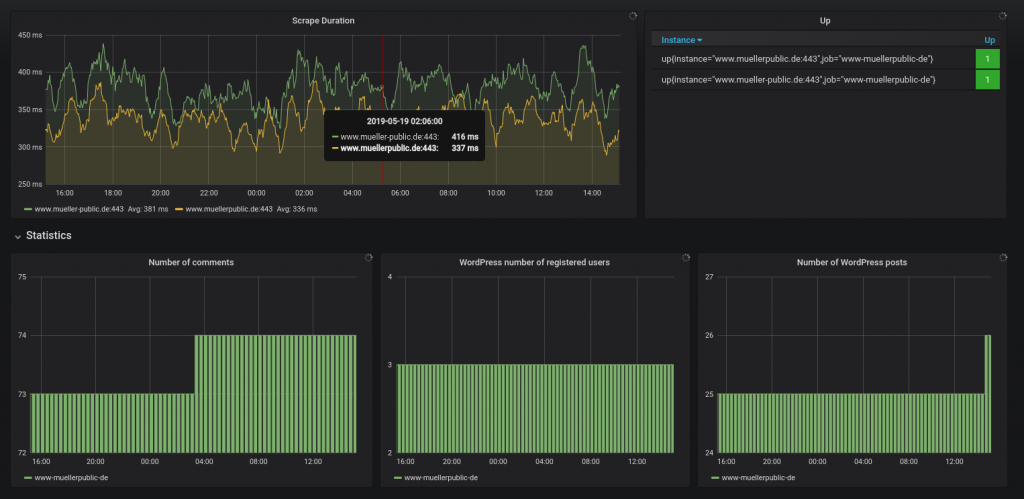
Grafana
After we have configures our scrape targets we can now setup a nice Grafana dashboard to see the metrics and to be informed if our WordPress site becomes unreachable for some reason. I have prepared a Grafana dashboard for that. It requires Grafana 6 and a Prometheus server as the data source.
[text title=“WordPress exporter dashboard-1558274559998.json”]
{
“__inputs”: [
{
“name”: “DS_PROMETHEUS”,
“label”: “prometheus”,
“description”: “”,
“type”: “datasource”,
“pluginId”: “prometheus”,
“pluginName”: “Prometheus”
}
],
“__requires”: [
{
“type”: “grafana”,
“id”: “grafana”,
“name”: “Grafana”,
“version”: “6.0.1”
},
{
“type”: “panel”,
“id”: “graph”,
“name”: “Graph”,
“version”: “5.0.0”
},
{
“type”: “datasource”,
“id”: “prometheus”,
“name”: “Prometheus”,
“version”: “5.0.0”
},
{
“type”: “panel”,
“id”: “table”,
“name”: “Table”,
“version”: “5.0.0”
}
],
“annotations”: {
“list”: [
{
“builtIn”: 1,
“datasource”: “– Grafana –”,
“enable”: true,
“hide”: true,
“iconColor”: “rgba(0, 211, 255, 1)”,
“name”: “Annotations & Alerts”,
“type”: “dashboard”
}
]
},
“editable”: true,
“gnetId”: null,
“graphTooltip”: 0,
“id”: null,
“iteration”: 1558268165521,
“links”: [],
“panels”: [
{
“aliasColors”: {},
“bars”: false,
“dashLength”: 10,
“dashes”: false,
“datasource”: “${DS_PROMETHEUS}”,
“fill”: 1,
“gridPos”: {
“h”: 8,
“w”: 12,
“x”: 0,
“y”: 0
},
“id”: 14,
“interval”: “”,
“legend”: {
“avg”: true,
“current”: false,
“max”: false,
“min”: false,
“show”: true,
“total”: false,
“values”: true
},
“lines”: true,
“linewidth”: 1,
“links”: [],
“nullPointMode”: “null”,
“paceLength”: 10,
“percentage”: false,
“pointradius”: 2,
“points”: false,
“renderer”: “flot”,
“seriesOverrides”: [],
“stack”: false,
“steppedLine”: false,
“targets”: [
{
“expr”: “avg_over_time(scrape_duration_seconds{job=\”$namespace\”}[30m])”,
“format”: “time_series”,
“interval”: “”,
“intervalFactor”: 1,
“legendFormat”: “{{instance}}”,
“refId”: “A”
}
],
“thresholds”: [],
“timeFrom”: null,
“timeRegions”: [],
“timeShift”: null,
“title”: “Scrape Duration”,
“tooltip”: {
“shared”: true,
“sort”: 0,
“value_type”: “individual”
},
“type”: “graph”,
“xaxis”: {
“buckets”: null,
“mode”: “time”,
“name”: null,
“show”: true,
“values”: []
},
“yaxes”: [
{
“format”: “s”,
“label”: null,
“logBase”: 1,
“max”: null,
“min”: null,
“show”: true
},
{
“format”: “short”,
“label”: null,
“logBase”: 1,
“max”: null,
“min”: null,
“show”: true
}
],
“yaxis”: {
“align”: false,
“alignLevel”: null
}
},
{
“cacheTimeout”: null,
“columns”: [
{
“text”: “Current”,
“value”: “current”
}
],
“datasource”: “${DS_PROMETHEUS}”,
“fontSize”: “100%”,
“gridPos”: {
“h”: 8,
“w”: 7,
“x”: 12,
“y”: 0
},
“id”: 12,
“links”: [],
“pageSize”: null,
“scroll”: true,
“showHeader”: true,
“sort”: {
“col”: 0,
“desc”: true
},
“styles”: [
{
“alias”: “Up”,
“colorMode”: “cell”,
“colors”: [
“rgba(245, 54, 54, 0.9)”,
“rgba(237, 129, 40, 0.89)”,
“rgba(50, 172, 45, 0.97)”
],
“decimals”: 0,
“pattern”: “Current”,
“thresholds”: [
“0”,
“1”
],
“type”: “number”,
“unit”: “short”
},
{
“alias”: “Instance”,
“colorMode”: null,
“colors”: [
“rgba(245, 54, 54, 0.9)”,
“rgba(237, 129, 40, 0.89)”,
“rgba(50, 172, 45, 0.97)”
],
“dateFormat”: “YYYY-MM-DD HH:mm:ss”,
“decimals”: 2,
“mappingType”: 1,
“pattern”: “Metric”,
“sanitize”: false,
“thresholds”: [],
“type”: “string”,
“unit”: “short”,
“valueMaps”: []
}
],
“targets”: [
{
“expr”: “up{job=\”$namespace\”}”,
“format”: “time_series”,
“intervalFactor”: 1,
“legendFormat”: “”,
“refId”: “A”
}
],
“timeFrom”: null,
“timeShift”: null,
“title”: “Up”,
“transform”: “timeseries_aggregations”,
“type”: “table”
},
{
“gridPos”: {
“h”: 1,
“w”: 24,
“x”: 0,
“y”: 8
},
“id”: 8,
“title”: “Statistics”,
“type”: “row”
},
{
“aliasColors”: {},
“bars”: true,
“cacheTimeout”: null,
“dashLength”: 10,
“dashes”: false,
“datasource”: “${DS_PROMETHEUS}”,
“decimals”: 0,
“fill”: 1,
“gridPos”: {
“h”: 9,
“w”: 7,
“x”: 0,
“y”: 9
},
“id”: 6,
“legend”: {
“avg”: false,
“current”: false,
“max”: false,
“min”: false,
“show”: true,
“total”: false,
“values”: false
},
“lines”: true,
“linewidth”: 1,
“links”: [],
“nullPointMode”: “null”,
“paceLength”: 10,
“percentage”: false,
“pointradius”: 2,
“points”: false,
“renderer”: “flot”,
“seriesOverrides”: [],
“stack”: false,
“steppedLine”: true,
“targets”: [
{
“expr”: “wp_num_comments_metric{namespace=\”$namespace\”}”,
“format”: “time_series”,
“instant”: false,
“interval”: “”,
“intervalFactor”: 10,
“legendFormat”: “$namespace”,
“refId”: “A”
}
],
“thresholds”: [],
“timeFrom”: null,
“timeRegions”: [],
“timeShift”: null,
“title”: “Number of comments”,
“tooltip”: {
“shared”: true,
“sort”: 0,
“value_type”: “individual”
},
“type”: “graph”,
“xaxis”: {
“buckets”: null,
“mode”: “time”,
“name”: null,
“show”: true,
“values”: []
},
“yaxes”: [
{
“decimals”: 0,
“format”: “short”,
“label”: “”,
“logBase”: 1,
“max”: null,
“min”: null,
“show”: true
},
{
“decimals”: null,
“format”: “short”,
“label”: “”,
“logBase”: 1,
“max”: null,
“min”: null,
“show”: true
}
],
“yaxis”: {
“align”: false,
“alignLevel”: null
}
},
{
“aliasColors”: {},
“bars”: true,
“cacheTimeout”: null,
“dashLength”: 10,
“dashes”: false,
“datasource”: “${DS_PROMETHEUS}”,
“fill”: 1,
“gridPos”: {
“h”: 9,
“w”: 6,
“x”: 7,
“y”: 9
},
“id”: 2,
“legend”: {
“avg”: false,
“current”: false,
“max”: false,
“min”: false,
“show”: true,
“total”: false,
“values”: false
},
“lines”: true,
“linewidth”: 1,
“links”: [],
“nullPointMode”: “null”,
“paceLength”: 10,
“percentage”: false,
“pointradius”: 2,
“points”: false,
“renderer”: “flot”,
“seriesOverrides”: [],
“stack”: false,
“steppedLine”: true,
“targets”: [
{
“expr”: “wp_num_users_metric{namespace=\”$namespace\”}”,
“format”: “time_series”,
“interval”: “”,
“intervalFactor”: 10,
“legendFormat”: “$namespace”,
“refId”: “A”
}
],
“thresholds”: [],
“timeFrom”: null,
“timeRegions”: [],
“timeShift”: null,
“title”: “WordPress number of registered users”,
“tooltip”: {
“shared”: true,
“sort”: 0,
“value_type”: “individual”
},
“type”: “graph”,
“xaxis”: {
“buckets”: null,
“mode”: “time”,
“name”: null,
“show”: true,
“values”: []
},
“yaxes”: [
{
“decimals”: 0,
“format”: “short”,
“label”: “”,
“logBase”: 1,
“max”: null,
“min”: null,
“show”: true
},
{
“format”: “short”,
“label”: null,
“logBase”: 1,
“max”: null,
“min”: null,
“show”: true
}
],
“yaxis”: {
“align”: false,
“alignLevel”: null
}
},
{
“aliasColors”: {},
“bars”: true,
“dashLength”: 10,
“dashes”: false,
“datasource”: “${DS_PROMETHEUS}”,
“fill”: 1,
“gridPos”: {
“h”: 9,
“w”: 6,
“x”: 13,
“y”: 9
},
“id”: 4,
“legend”: {
“avg”: false,
“current”: false,
“max”: false,
“min”: false,
“show”: true,
“total”: false,
“values”: false
},
“lines”: true,
“linewidth”: 1,
“links”: [],
“nullPointMode”: “null”,
“paceLength”: 10,
“percentage”: false,
“pointradius”: 5,
“points”: false,
“renderer”: “flot”,
“seriesOverrides”: [],
“spaceLength”: 10,
“stack”: false,
“steppedLine”: true,
“targets”: [
{
“expr”: “wp_num_posts_metric{namespace=\”$namespace\”}”,
“format”: “time_series”,
“interval”: “”,
“intervalFactor”: 10,
“legendFormat”: “$namespace”,
“refId”: “A”
}
],
“thresholds”: [],
“timeFrom”: null,
“timeRegions”: [],
“timeShift”: null,
“title”: “Number of WordPress posts”,
“tooltip”: {
“shared”: true,
“sort”: 0,
“value_type”: “individual”
},
“type”: “graph”,
“xaxis”: {
“buckets”: null,
“mode”: “time”,
“name”: null,
“show”: true,
“values”: []
},
“yaxes”: [
{
“decimals”: 0,
“format”: “short”,
“label”: “”,
“logBase”: 1,
“max”: null,
“min”: null,
“show”: true
},
{
“format”: “short”,
“label”: null,
“logBase”: 1,
“max”: null,
“min”: null,
“show”: true
}
],
“yaxis”: {
“align”: false,
“alignLevel”: null
}
}
],
“refresh”: “5m”,
“schemaVersion”: 18,
“style”: “dark”,
“tags”: [],
“templating”: {
“list”: [
{
“allValue”: null,
“current”: {},
“datasource”: “${DS_PROMETHEUS}”,
“definition”: “label_values(wp_users_total, job)”,
“hide”: 0,
“includeAll”: false,
“label”: “Namespace”,
“multi”: false,
“name”: “namespace”,
“options”: [],
“query”: “label_values(wp_users_total, job)”,
“refresh”: 1,
“regex”: “”,
“skipUrlSync”: false,
“sort”: 0,
“tagValuesQuery”: “”,
“tags”: [],
“tagsQuery”: “”,
“type”: “query”,
“useTags”: false
}
]
},
“time”: {
“from”: “now-24h”,
“to”: “now”
},
“timepicker”: {
“refresh_intervals”: [
“5s”,
“10s”,
“30s”,
“1m”,
“5m”,
“15m”,
“30m”,
“1h”,
“2h”,
“1d”
],
“time_options”: [
“5m”,
“15m”,
“1h”,
“6h”,
“12h”,
“24h”,
“2d”,
“7d”,
“30d”
]
},
“timezone”: “”,
“title”: “WordPress exporter dashboard”,
“uid”: “qtFzy1dik”,
“version”: 12
}
[/text]